

--XPLC006E Function Introduction--

XPLC006E
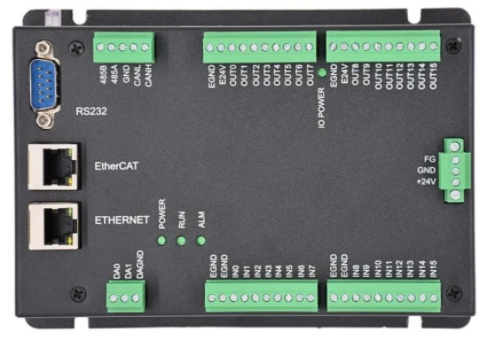
is a kind of multi-axis economical EtherCAT bus motion controller developed by ZMotion Technology, and XPLC series motion controllers can be applied in all kinds of occasions that need offline or online operation.

XPLC006E has 6 motor axes itself, and motion control of 12 axes at most can be achieved (including virtual axes). Also, it supports 12-axis linear interpolation, electronic cam, electronic gear, synchronous follow, virtual axis setting, etc.
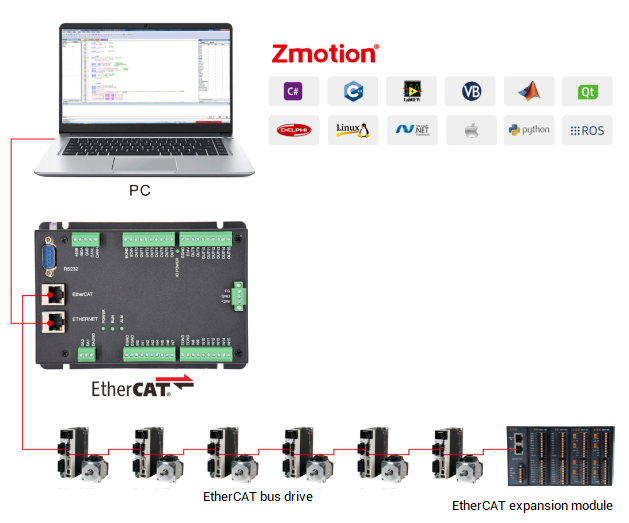
In addition, XPLC006E cost-effective controller supports multi-task run synchronously. At the same time, it can do simulation on PC directly. There are several valid programming methods, such as, Basic / PLC ladder diagram / HMI configuration in ZDevelop software and commonly used upper computer software.
For PC upper computer API programming, following interfaces are supported: C#, C++, LabVIEW, VB, matlab, Qt, Linux, .Net, iMAC, Python, ROS, etc.

→Actually, according to different axis numbers, there are XPLC004E, XPLC006E and XPLC008E
There is one note: XPLC006E belongs to bus motion controller, which means it only supports EtherCAT bus axes, pulse axes and encoder axes are invalid. Then, it uses EtherCAT bus and drive to communication with refresh cycle of 1ms.
--XPLC864E2 Function Introduction--

Let's see
XPLC864E2
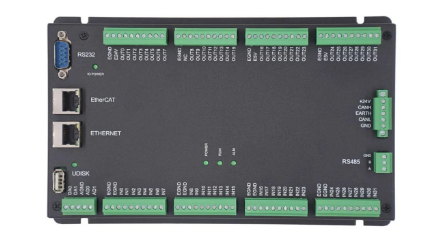
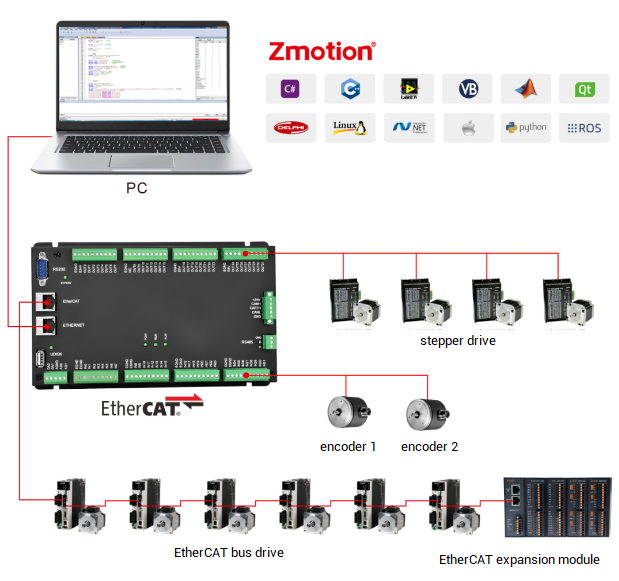
, it is upgraded on the basis of XPLC006E, which means, it supports all functions of XPLC006E mentioned above, and usages are basically the same. However, some resource spaces are better than XPLC006E. What's more, XPLC864E2 supports 32 inputs, 32 outputs, 2 ADs and 2 DAs in hardware level, pulse axis and bus axis can be hybrid used. The number of real axes is 8 totally. Except EtherCAT interface, in hardware of output, signal output of 8 axes in pulse direction can be configured, and be with 2 encoder inputs set by input configuration.
Same, XPLC864E2 supports PLC, Basic and HMI configuration programming methods. For PC upper computer API programming, following interfaces are supported: C#, C++, LabVIEW, VB, matlab, Qt, Linux, .Net, iMAC, Python, ROS, etc.


Here, Part 9 of ZMotion Economical EtherCAT Bus Motion Controller: oscilloscope introduction.
Let’s begin.
1. What the oscilloscope can do ?
Oscilloscope is extremely important of program debugging and running. It is used to transfer signals that can’t be seen by naked eyes into graphics, then it is convenient to analyze change processes of all kinds of signals, such as, the speed and position changes of the current axis.
Specifically, it uses the data that are processed by controller inside to get the current value every certain time. Then, it can show those values as the graph over time, different signals can be displayed, like, axis parameter, axis status, etc.
“View” – “Scope”, then oscilloscope window can be opened.

Please attention, oscilloscope must be opened firstly, then triggered, it can successfully sample. Turn on the oscilloscope, click "Start Scope" after setting the relevant parameters. Also, it could be manually triggered sampling, or add the "TRIGGER" instruction to the program to automatically trigger the oscilloscope sampling.
(1) Main interface
Here mainly describes button functions on the main interface of the oscilloscope.
basic configuration
Config: open oscilloscope configuration window, set relevant parameters
Start Scope: start oscilloscope (which means oscilloscope is ready, waiting for trigger sampling)
Stop: stop oscilloscope capture
Xscale: the scale of horizontal axis (time) under YT mode, and this parameter is invalid under other modes
<<: press to hide the channel name and peak value, and only display the channel number.
Continuous acquisition: when the continuous acquisition is not enabled, the sampling will stop when the sampling depth is reached. After the continuous acquisition is enabled, the oscilloscope will continue to sample.
Follow: After the following is enabled, the horizontal axis automatically moves to the real-time sampling point and follows the waveform display.
Trigger: manually trigger oscilloscope capture button (use TIGGER instruction to trigger automatically)
Import and export: export captured point as txt file, load again, click “import”
show mode
YT mode: curves of different data sources over time
XY mode: display the synthetic trajectory of two axes on a certain plane, and synthesize and display the curves of the first and second channels, which is suitable for two-axis interpolation
XYZ mode: display the synthetic trajectory of three axes in space, and synthesize and display the curves of the first, second and third channels, which is suitable for three-axis interpolation
data acquisition configuration
Show: choose whether the present channel curve shows or not
Index: select the data source number that needs to be captured, such as, axis number, digital IO number, analog IO number, TABLE number, VR number, MODUBUS number, etc.
Source: select captured data type
Offset: Set the offset of the vertical axis of the waveform.
Yscale: The scale of one grid on the horizontal axis.

If sets oscilloscope parameters, like, axis number, data source and start oscilloscope configuration window, it should stop firstly, then to configure.
(2) Configuration interface
Click “Config”, below “Scope Config”will pop up.

Chanel Num: channel total numbers to be sampled.
Depth: total sampling numbers, the depth is bigger, the sampling ranger is bigger.
Space: sampling time space. The unit is system cycle, which is related to the firmware version of the controller. Generally, default is 1ms, and see it through SERVO_PERIOD instruction. Usually, the smaller the space, the more accurate the sampled data, and the larger the amount of data per unit time.
TABLE Pos: Set the position where the captured data is stored. Generally, the space at the end of the TABLE data is automatically used by default, and you can also customize the configuration, but be careful not to overlap with the TABLE data area used by the program when setting.
BackCor/Channel Color: set background and the color related to each channel’s waveform.
ShowType: there are two curve types to be chosen, point and line. Abnormal data is easily found out by Line.
Export parameters: export oscilloscope parameters.
(3) Data import & export
Import: data can be imported when oscilloscope stops, and if it is imported successfully, sampling waveform will reappear.
The method of importing sampling data: click “Import”, import data file that should be the former file type exported from oscilloscope, then open it.
Export: export parameters, including oscilloscope parameter configuration, data type of each channel and each sampling point’s data.
The method of exporting data: click “Export parameters” in “Scope Config”, then start scope. After sampling, click “Export”, and select folder to store oscilloscope data, the exported data is text file.
As shown in the figure below, the data exported by the two channels of sampling axis 0, the DPOS position and the MSPEED speed.

(1) Reference steps
→ Open project, connect to controller or simulator, then open the oscilloscope window (note: first, connect to controller or simulator, then operate the oscilloscope window).
→ Click “Scope Config” in oscilloscope window, select sampling channel numbers, sampling depth, sampling space, sampling data TABLE stored position (generally the end position of TABLE array will be used automatically) and sampling type, etc. Then, click “OK” for saving this configuration.
→ Select sampling Index and Source, click “Start Scope”.
→ Download program into controller, the program should include TRIGGER, the trigger oscilloscope sampling automatically instruction. Now, it starts sampling and shows different data source’s waveforms. It can adjust Show Scale and Wave Offset for observing different waveforms.

If the waveform accuracy is not high or the display is incomplete, click the "Stop" button and then open the "Scope Config", then adjust the sampling space and sampling depth, and perform the above sampling process again.
If the sampling time is long, start “Continuous acquisition” function.
(2) Precautions
continuous acquisition
When continuous acquisition is not selected, the oscilloscope automatically stops sampling when the sampling depth is reached.
First select “Continuous acquisition” in “Scope Config”, then start oscilloscope, it will continue to sampling after triggered, and sampling even if it reached the depth. It will stop until press “Stop” button manually.
All waveforms and captured data from continuous acquisition can be exported.
XY mode / XYZ mode
Since these two acquisition modes synthesize the data of the first two/three channels, attention should be paid to the type of data source. Some data synthesis is meaningless.For example, the synthesis curve of speed and position curve is meaningless. It is generally used to view synthetic interpolation trajectories.
Oscilloscope sampling time calculation
For example, depth: 1000, space: 5
If system cycle is SERVO_PERIOD=1000, which means 1ms trajectory planning cycle. Space 5 means sampling one data point per 5ms.
Total sampling data number is 10000, so sampling time length is 50s.
TABLE data end storage space calculation
Set the position where the captured data is stored. Generally, the space at the end of the TABLE data is automatically used by default, now starting space address is calculated automatically according to captured data space.
Calculation method: captured data space = channel numbers * depth
For example, if TABLE space of controller is 320000, there are 4 sampling channels, depth is 30000, each sampling point occupies one TABLE, so it will occupy 4*30000=120000 TABLE positions. 320000-120000=200000, which means starting position of TABLE is 200000.
The position for storing data also can be self-defined, if according to above channel number and depth, TABLE starting space can’t exceed 200000 when it is self-defined, otherwise, it can’t be configured, please see below picture:

The space occupied by the oscilloscope sample data should not overlap with the TABLE data area used by the program.
Controller TABLE space can be read through TSIZE instruction, check “Controller Status” or input ?*maxto print and check.
4. Ro uti nes of oscilloscope
(1) Linear interpolation

DPOS position curve of 3 axes under YT mode

In XYZ mode, the three-axis position synthetic trajectory is the actual processing trajectory

(2) Auto-cam fly shearing
Suppose the length of the profile to be cut is 4m, the working distance of the table is 1m, the axis 1 is the basic axis (profile transmission), the axis 0 is the following axis (following shear table), and the OUT0 port controls the tool. The flying shear part program is as follows.

The waveforms of speed and position are shown in the figure below: Axis 1 is the conveyor belt moving at a constant speed, and Axis 0 is the chasing shear axis.
The movement distance of the workbench (following axis): 0.4 (acceleration stage) + 0.2 (following synchronization) + 0.4 (deceleration stage) = 1m unit, and then -1m return movement.
The movement distance of the profile (reference axis): 1+0.8+0.2+0.8+1.2=4m unit, uniform speed throughout the process.

(3) Single-axis PSO position synchronization output
After the hardware comparison output instruction is triggered, it reaches the comparison point and outputs the OP signal. The PSO schematic diagram is shown in the figure below, and ZMC432 is used as an example to demonstrate.


The waveform of the output changing with the trajectory is shown in the figure below. HW_PSWITCH2 controls the OP to reverse once every time it reaches a TABLE point position. After all points of the TABLE are compared, the OP will not reverse and maintain the last level state.

(4) PSO output of 2D / 3D
The two-axis PSO position synchronously output, then output the OP signal when the comparison point is reached. Take ZMC432 as an example for demonstration.
The PSO function supports fixed-period output, also supports fixed-distance output, as shown in the right figure below. The fixed-distance output makes the output at the corner even when deceleration is required, such as corners, without accumulation.

waveform under YT mode
Comparing 20 points, the OP is reversed once for each comparison. The last part of each movement is in the deceleration section because of the addition of SRAMP speed smoothing processing, so the same distance, the movement time is longer, and the time interval of OP reversal is also extended accordingly.

3D waveform under XYZ mode

For more information, please pay close attention to "Support" and